(Léelo en español en YV Polis)
There is a little more than a month left to go before the next presidential election in Venezuela and the polls are just as murky as they were in July. The last month has seen a new batch of polling results that range from a 20-point lead for President Hugo Chávez to a 2-point lead for the challenger, Miranda Governor Henrique Capriles Radonski. Given this variability, the exercise we did in this blog last month (see the previous post here, léelo en español aquí) continues to be of use; I will take those same measures of correction and apply them to the latest poll available for each firm.
Recapitulating
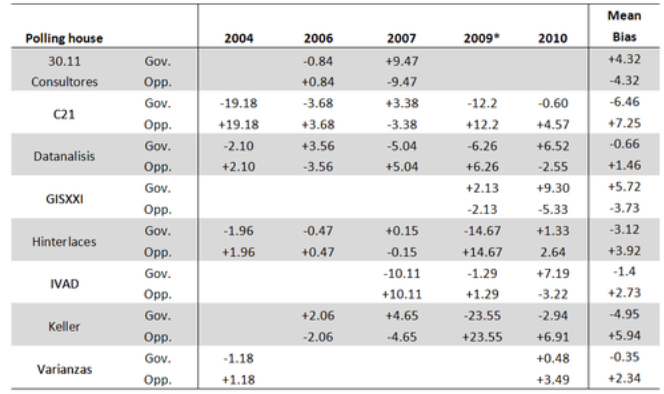
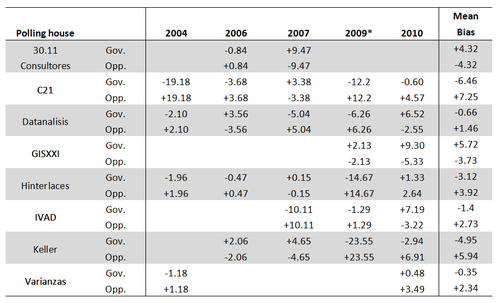
First, let’s briefly review the previous post. In it I argued that polling houses typically tend to err in one direction, which allows us to determine a measure of bias with which we can correct current predictions. Second, I highlighted two scenarios from the previous electoral contests: 1) a scenario where the polls were had the opposition ahead, but the government won (like in 2004 and 2009); and 2) a scenario where the government was thought to be ahead but where the opposition ended up winning or coming very close to doing so (like in 2007 and 2010). These two scenarios served as the basis for two measures of “correction” for current polls. A third measure of correction was based on the average of all errors for the previous elections. These correction terms can be seen in the table below.
Table 1. Mean error by polling house for each election (Same as before)
Apropos of some thoughtful comments I’ve received, I would like to briefly explain why I choose to average all of a firm’s pre-election polls to create my correction term for a firm’s performance in a given election, instead of just using the last poll.
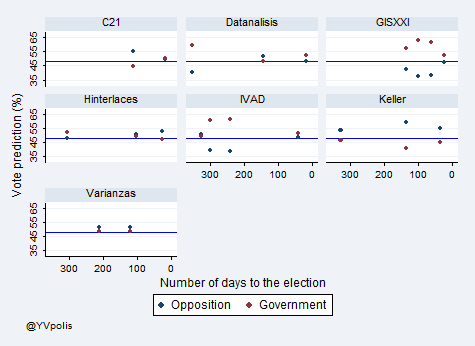
Several commentators have suggested that by averaging all of a pollster’s polls over an electoral cycle, regardless of when they were carried out, I am punishing good pollsters when the support for the two political options changes over the course of the electoral cycle. (Think of the 2004 referendum, for example, when the opposition was clearly ahead in June but the government surged ahead over the course of the following two months). This is a valid concern. To put this graphically let’s take a look at figure 1. Here we can see the different predictions made throughout the race by the different polling houses. We can also see a horizontal line depicting the actual votes of both the government (red) and the opposition (blue) –the election was so close that the lines look like one.
Figure 1. Evolution of vote predictions through time for different polling houses for the 2010 parliamentary election
However, in absence of a valid measure of “real” public opinion at any point before the election, there is no reliable way to evaluate any given poll. Furthermore, there is an intrinsic problem with just using the last poll before the election. If we only use the last poll to estimate their bias, we can err and give bad pollsters a good reputation. Let’s say there are two pollsters—one that consistently favors the government and other that consistently favors the opposition. Throughout the race they give very different poll results but at the end come up with the “right” result. Does that mean that all their polls throughout were not biased? Of course not.
So it ends up being an analytic decision regarding whom we penalize and whom we reward. If we use the average—as I do—we penalize good pollsters; if we use the last poll we reward bad pollsters. I prefer to penalize good pollsters over rewarding bad ones because it seems like the lesser of two evils. Furthermore, at this stage in the election, people are wondering about the validity of the polls coming out now, not the last polls that will come out shortly before the election.
The 2012 Race—August Update
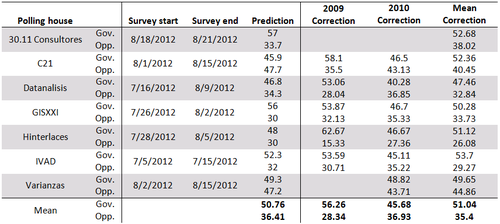
Since my last analysis at the end of July, several new polls have been made public; most of them from late July and early August. The only pollster with no new polls made public is Keller, which is therefore not included in this analysis (this exclusion does not affect the results of the analysis). Table 2 shows the predictions with the dates of each poll and the three corrections mentioned above: the 2009 correction for the scenario where the opposition underperforms its poll numbers, the 2010 correction where the government underperforms, and the mean correction.
As can be seen in the 2010 scenario, the most competitive—and I think the most realistic—no pollster has Chavez with more than 50% (after the correction); the highest is Varianzas with 49%. With regard to the opposition, the sole pollster with a corrected prediction for Capriles under 30% is Hinterlaces; otherwise, the polls point to somewhere in the 35-44 range for Capriles.
Table 2. Last prediction available, by polling house, for the 2012 race and correction based on alternative race dynamics
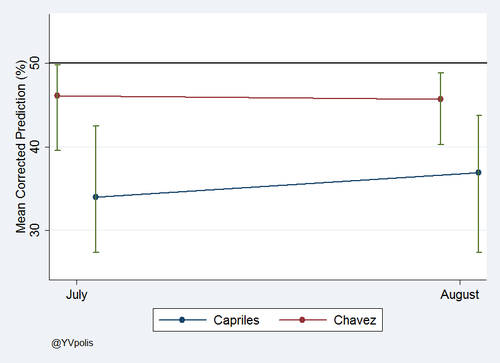
Finally, when we look at all these corrected polls together (taking the mean of the 2010 correction scenario) and compare it to the mean of corrected results from the previous bath of polls, we obtain Figure 2. There are several interesting facts to highlight from this graph:
1) Chávez remains below 50%. His mean numbers, while down a notch, remain stable. This time, however, it seems that the range of values shrank and became smaller, i.e. pollsters are agreeing on where Chávez is.
2) Capriles’ numbers have increased from around 34 to around 37. Considering that Chávez is at 46 this makes the gap only 9 points. Unlike Chávez’s numbers however, the uncertainty (the range) around Capriles increased, which implies little agreement amongst pollsters.
Figure 2. Mean and range of corrected predictions (2010 scenario) for July and August polls.
As it stands the race is getting closer. In many countries, a 10-point difference would be considered a done deal for the incumbent. Several factors, however, make Venezuela different in 2012. First, a large number of voters remain undecided (around 20%). Their decision to vote or not will have a huge impact, especially if they disproportionately back one option. Second, Capriles has been consistently increasing his vote intention—even in pro-government polls—while Chávez has remained static. If this trend continues, then Capriles will be in a position to close the gap.
Furthermore, the
huge explosion at Venezuela’s largest oil refinery (Amuay) killing 48 people could impact the race. It’s the equivalent of an “October surprise” in U.S. politics. A good handling of the crisis by the government could improve Chávez’s poll standings, while a bad handling could sway undecided voters against him. Similarly, an overt politicization of this disaster by the opposition could hurt Capriles standing as it might remind undecided voters of the pre-2006 opposition.